

When tech stocks melted up, Bitcoin 10x’d, and JPEGs sold for six-figure price tags, the headlines screamed “growth.” But it wasn’t growth. It was something else entirely — a surge of liquidity looking for somewhere to go. And central banks stood back and watched, convinced inflation would never stick. That belief, combined with flatlined money velocity and bloated balance sheets, created the perfect conditions for one of the largest financial bubbles in recent memory.
We’ve been here before. And if things line up again, we could be heading straight back into that setup — just with different names on the tokens.
2020–2021: When Liquidity Trumped Fundamentals
The period between late 2020 and late 2021 saw tech stocks fly, Bitcoin go from $3,800 to nearly $69,000, and altcoins like Solana run from $1 to $250. Retail flooded in. Institutions followed. NFTs flipped for more than suburban homes. On paper, it looked like a once-in-a-generation tech breakout.
But under the surface, money velocity — the rate at which money moves through the economy — was dead. The engine wasn’t running hotter. It was flooded. Liquidity was abundant, but it wasn’t translating into economic throughput. Instead, it was piling into assets, chasing yield, and blowing bubbles.
This wasn’t a reflection of productive expansion. It was what happens when central banks dump excess liquidity into a system with no productive outlet. Investors had no choice but to bid up risk.
Central Banks Were Still Calling It 'Transitory'
Through all of this, central bankers maintained that inflation wasn’t a concern. "Transitory" was the word of the year. Rates stayed pinned to the floor. Quantitative easing continued. And markets kept climbing.
They weren’t responding to overheating conditions — because there were none. There was no boom in consumer demand or industrial production. It was liquidity with nowhere else to go. And in that vacuum, prices soared across everything speculative.
The “growth” was an illusion. It was a balance sheet trick, fuelled by suppressed yields and aggressive stimulus.

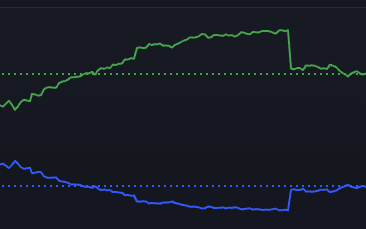
The Liquidity Signal: Velocity Down, M2/GDP Up
If you needed a single chart to explain what really happened, it would show three things:
- Money velocity collapsing
- M2 (money supply) relative to GDP spiking
- Risk assets going vertical
It wasn’t complicated. Money wasn’t being spent into the real economy — it was being rotated into assets. And with central banks suppressing the cost of capital, the entire market structure rewarded speculation over discipline.
The result? A historic melt-up that left value stocks in the dust and rewarded leverage and narrative more than fundamentals or cash flow.
Why This Still Matters in 2025
Fast forward to now — and the picture isn’t much different.
Money velocity remains at depressed levels. M2/GDP remains elevated. And with inflation finally showing signs of rolling over, the question becomes obvious: what happens if the Fed cuts into this environment?
The answer: the same fuel that launched the last cycle is still sitting in the tank.
We haven’t exited the liquidity era — we’ve just been paused. If policy reverses and rate cuts return while velocity remains low, markets will respond. Not because the real economy is improving, but because capital will again have nowhere else to go.
Bitcoin, tech, and risk assets could catch fire long before growth returns.
Conclusion
None of this is theoretical. We’ve already seen how low velocity and high liquidity combine to inflate risk. We lived through it. From Bitcoin’s 10x to Solana’s $250 moonshot, it was all built on the back of a broken monetary transmission.
The ingredients haven’t changed. The trigger might. And if the Fed steps back while markets are still this saturated with idle liquidity, we could see another leg of the cycle — fast, aggressive, and entirely driven by the same forces that powered the last one.


Discussion