

Most traders drown in headlines. They chase every tweet, every data drop, every whisper of “Fed pivot” without ever checking what actually matters. But the real edge — especially in macro — is watching the right charts, not the loudest narratives.
This isn’t about predictions. It’s about posture. Liquidity flows. Relative stress. Risk appetite. If you know what signals to watch, you’ll see the structure shift before the headlines catch up.
Here’s the current Macro Checklist that tells you everything you need to know about where we are — and what might be coming next.
VIX: Volatility as a Trigger, Not a Warning
The VIX measures implied volatility on S&P 500 options — a proxy for fear, hedging activity, and overall market stress. When the VIX is above 25–30, it means markets are bracing for chaos. When it collapses under 15, it signals complacency.
Right now:
- VIX has spiked, but isn’t holding elevated levels
- It collapsed quickly on recent rallies — a classic sign of positioning unwind
- Gamma flipped, and risk appetite returned fast
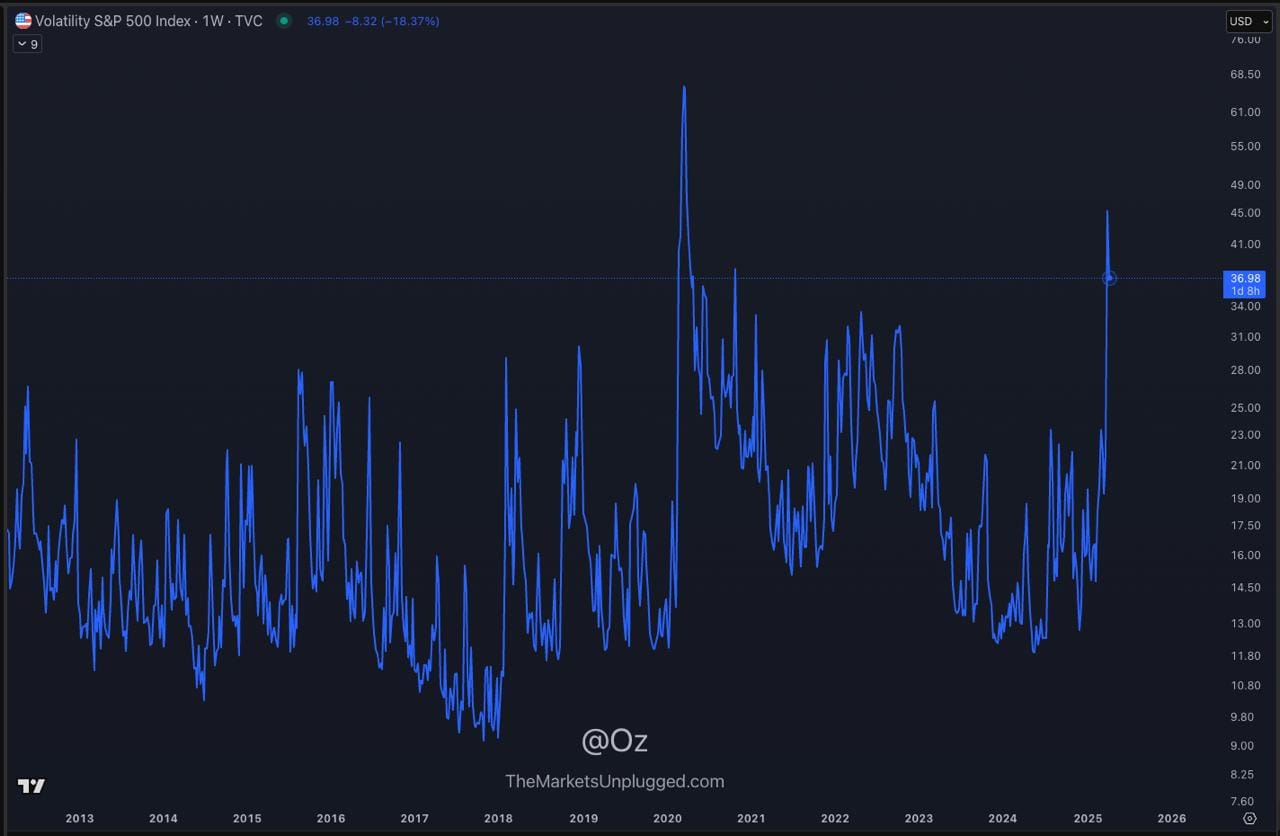
What it means: This isn’t systemic panic. It’s a volatility reset. When VIX drops after a spike and the market rallies hard, it’s not relief — it’s real money rotation.
Stocks: Ripping Despite the Noise
Despite recession fears, trade war narratives, and geopolitical tension, equities are holding strong:
- SPX reclaimed key levels
- Breadth is improving, led by risk-on sectors like tech and semis
- Volume-backed breakouts are starting to reappear
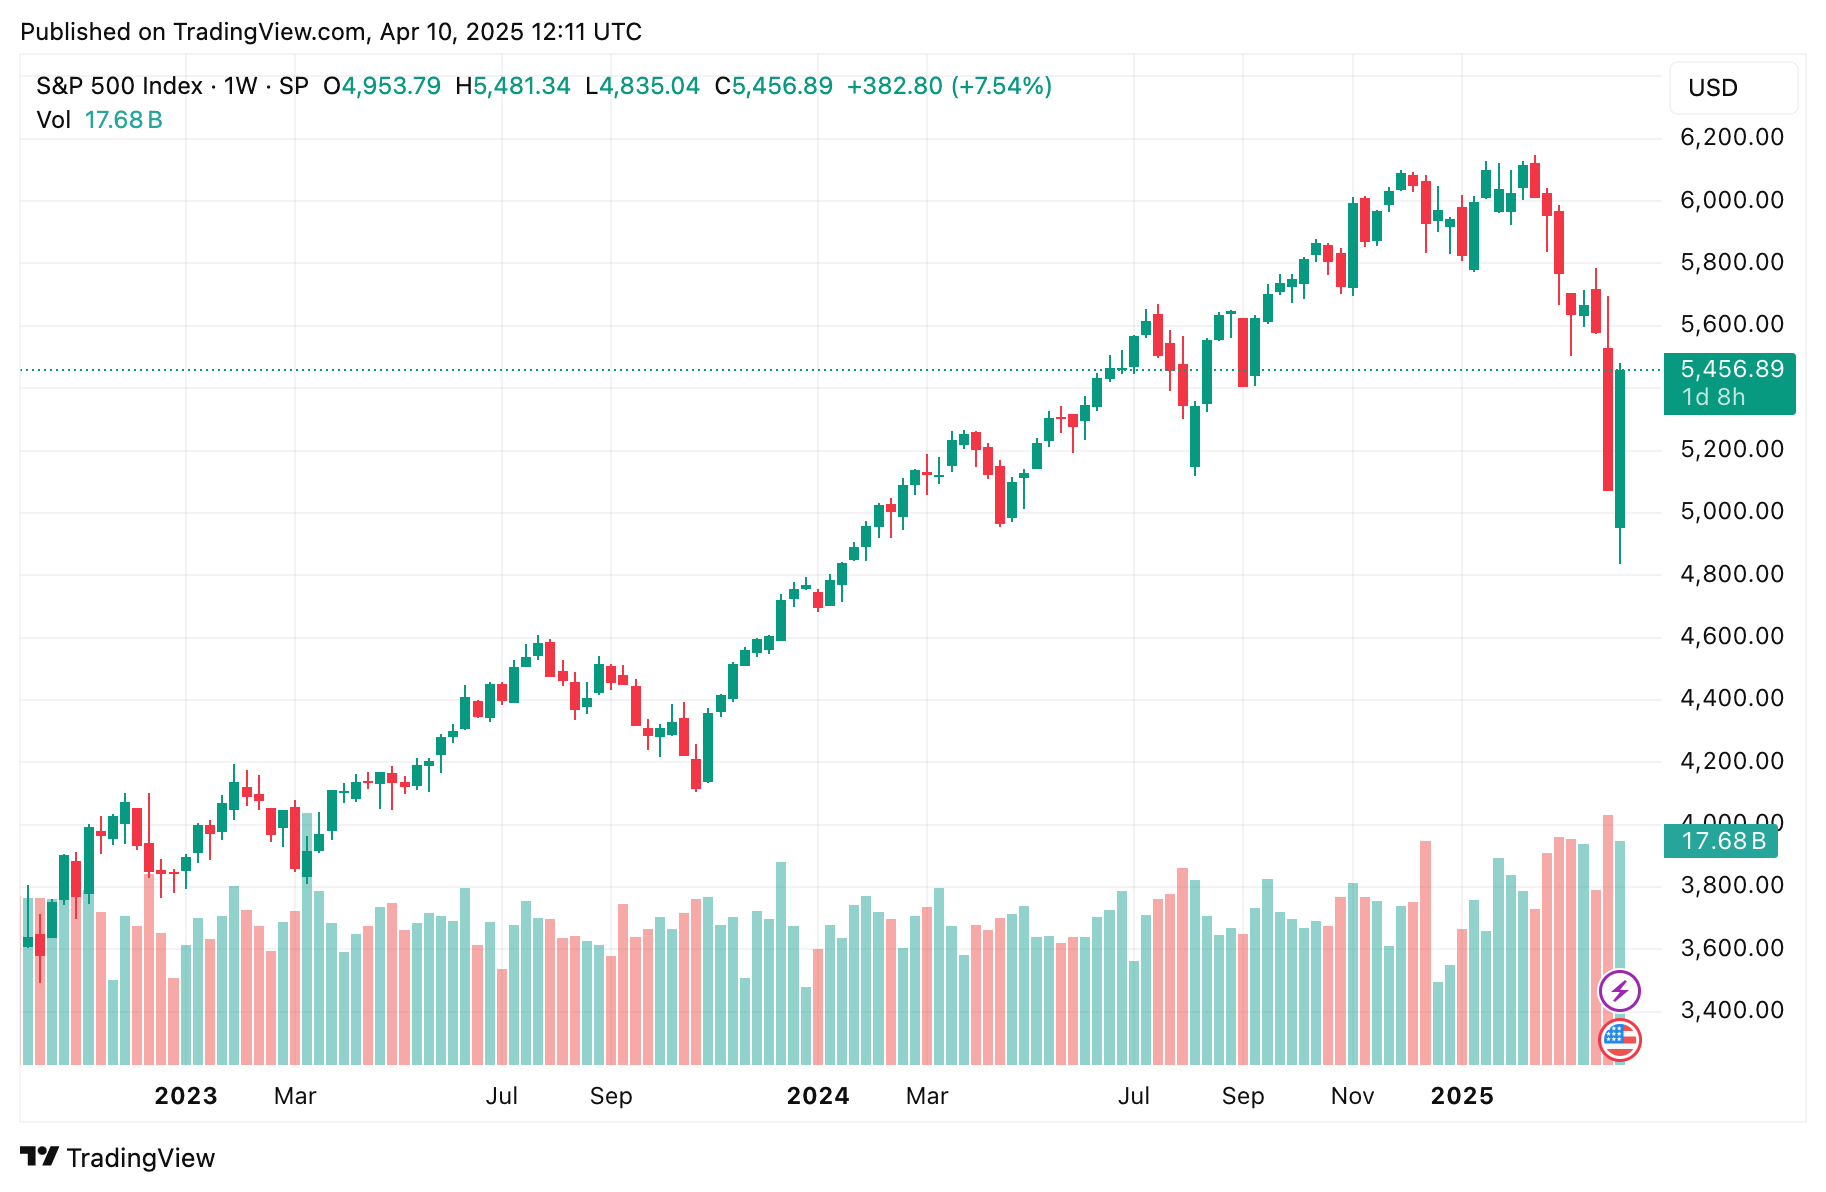
The S&P didn’t need a Fed cut or stimulus headline — it moved when hedges got cleared and liquidity started flowing again.
What it means: This isn’t a fake rally. It’s structural — driven by positioning, not hype.

Oil: The Silent Geopolitical Gauge
Crude is one of the most misunderstood macro signals. It reflects both demand and risk premium — but also serves as a trigger for inflation expectations.
Current picture:
- WTI is holding above $85
- No massive backwardation
- No supply shock pricing
Yes, Middle East tensions are real. But oil isn’t trading like a panic bid. It’s stable but firm — suggesting tight supply, not global demand collapse.

What it means: Inflation is sticky, but not spiralling. This keeps the Fed in check — not panicking.
US10Y / US2Y: Yield Curve Still Warning, But Steepening
The yield curve — specifically the 2s/10s spread — remains inverted. But it’s steepening. That’s a very different signal than it was last year.
Key observations:
- 2Y yields have dropped fast
- 10Y holding more firm
- The steepener is bullish, not bearish
A bull steepener suggests the market sees cuts ahead — and a need to pre-position for liquidity re-acceleration.
What it means: This is no longer about recession — it’s about timing the pivot.
DXY: The Dollar Isn’t Buying the Panic
The Dollar Index (DXY) tells you whether the market is truly pricing in global stress. If this were 2008 or 2020 panic levels, DXY would be surging.
Instead:
- DXY is flat to weak
- No EM flight-to-safety flows
- No Treasury shortage or global dollar stress
Despite all the noise — trade war, CPI nerves, yields moving — the dollar is behaving like nothing’s broken.
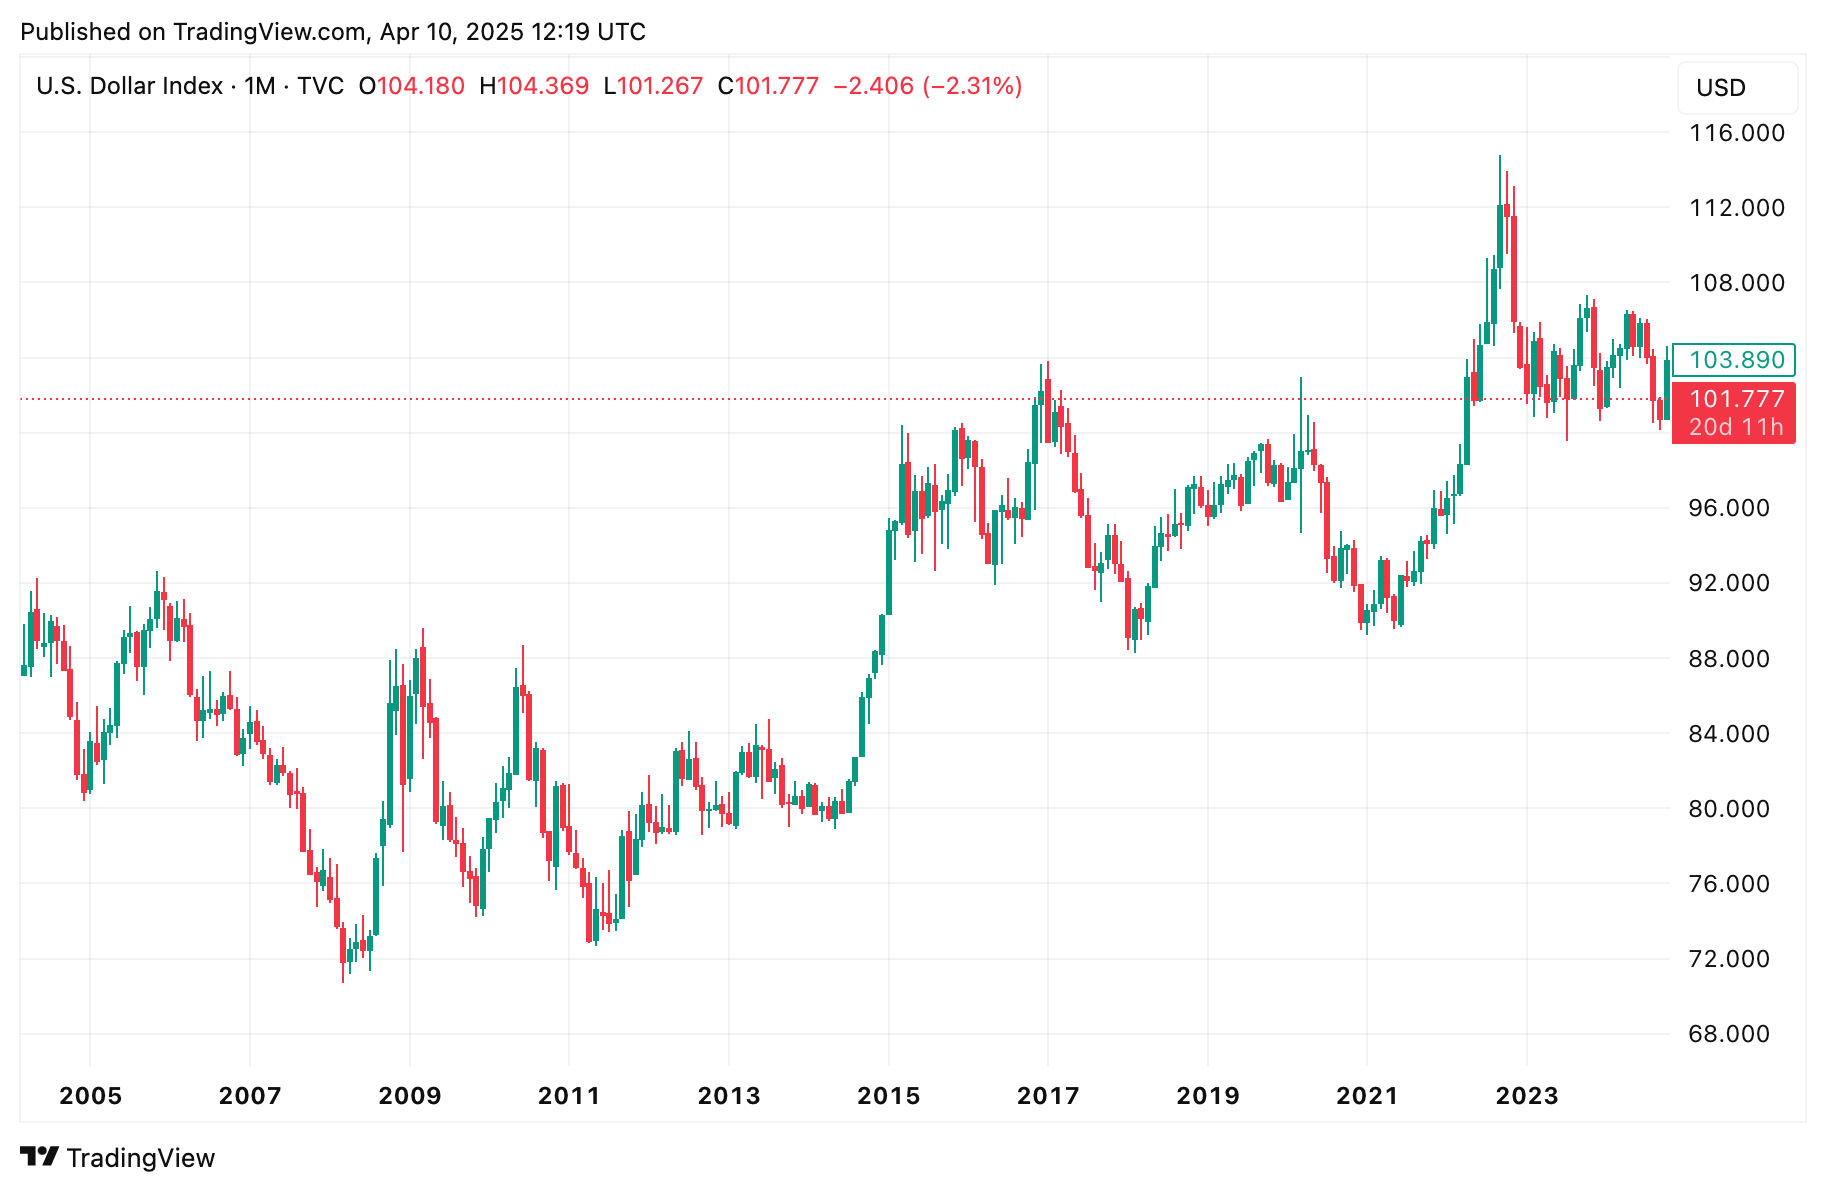
What it means: The panic is narrative-driven, not structural. No dollar spike = no global crisis.
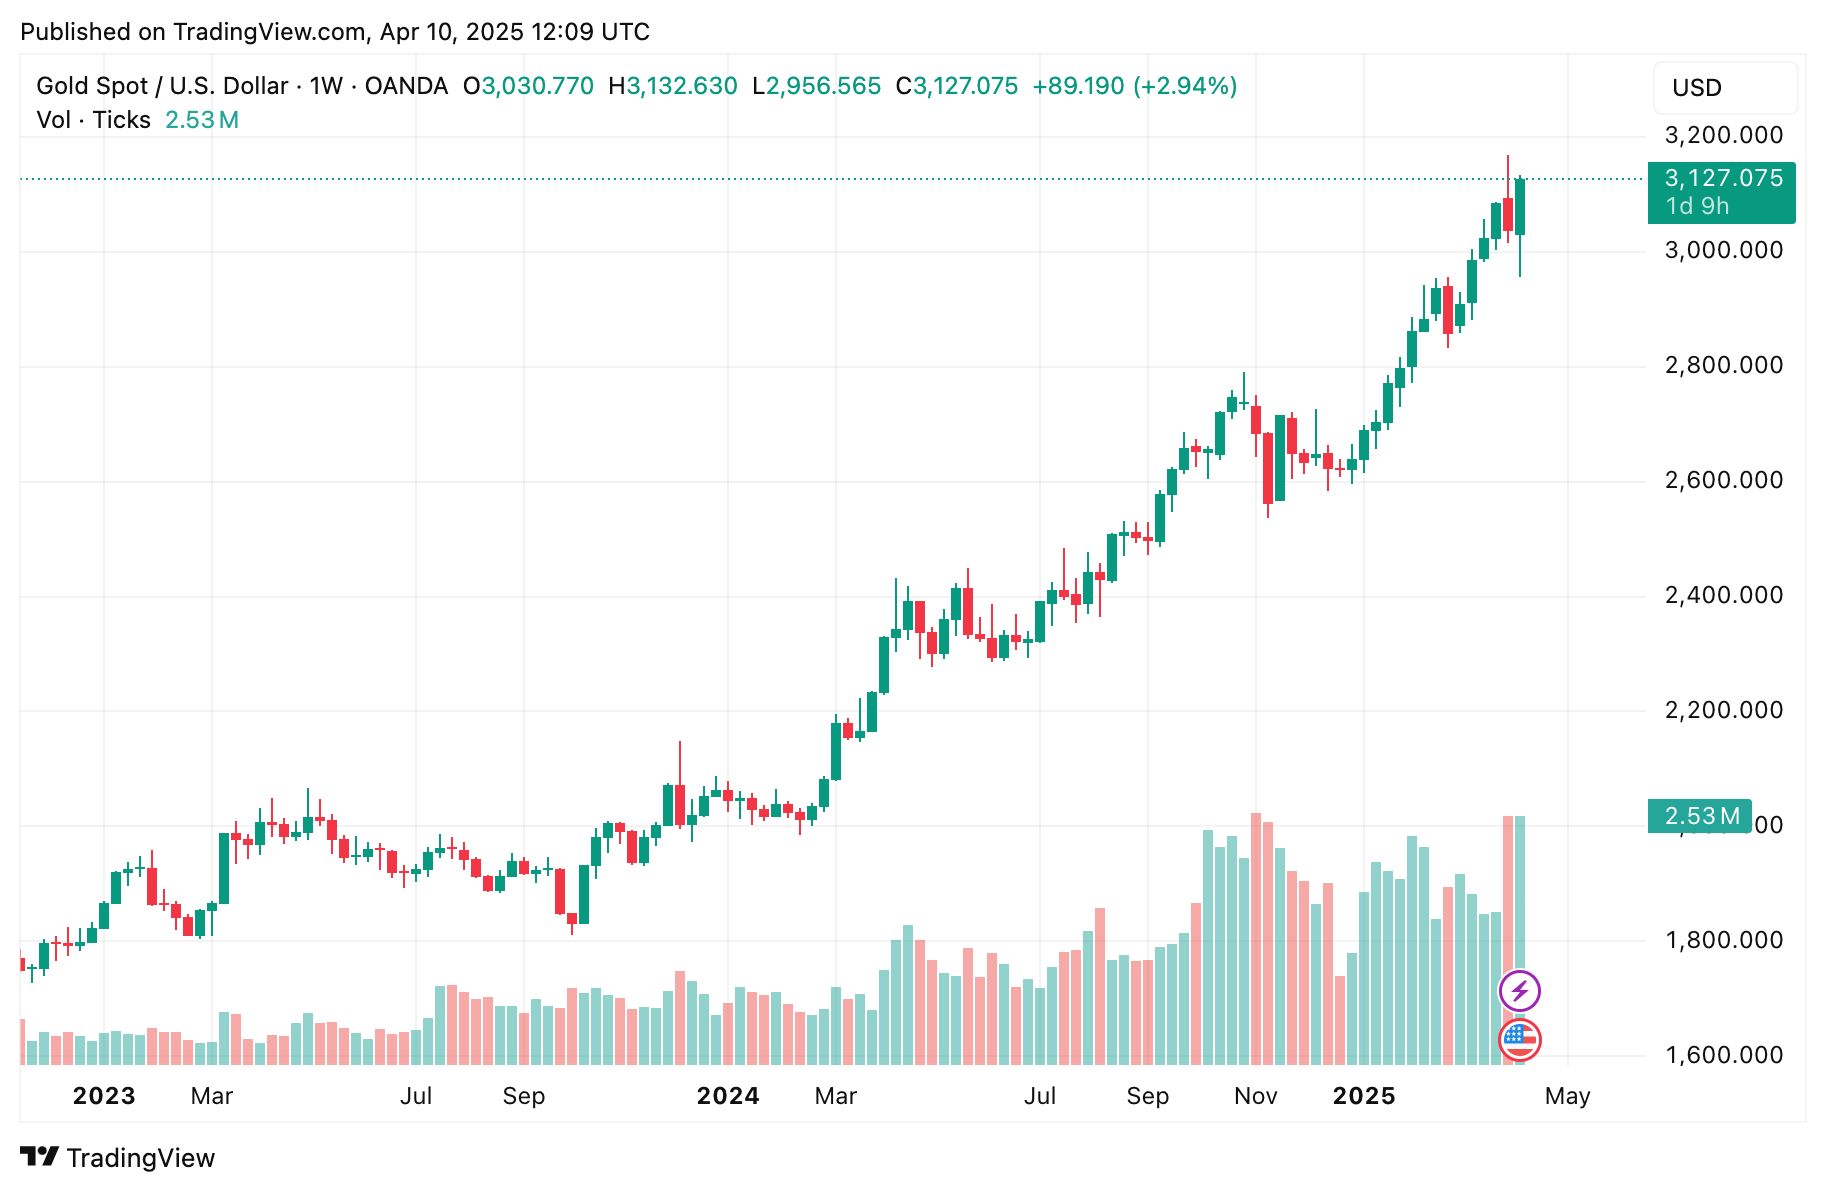
Gold: Bid, But Not Screaming
Gold tends to bid in three conditions: falling real yields, geopolitical fear, and debasement anticipation.
Right now:
- Gold has broken to new highs
- But the move is measured, not parabolic
- It’s not dragging silver, which usually confirms explosive breakouts
What it means: Investors are hedging for policy easing, not catastrophe. Gold is seeing rotation — not desperation.
Copper: Demand Signal Hidden in Plain Sight
Copper is rarely a hot macro talking point — but it should be. It’s the ultimate “real economy” barometer. You don’t buy copper unless you believe in industrial activity, EV expansion, and China stability.
Current chart:
- Copper is up 8%+ in recent sessions
- That’s a risk-on signal, not recession pricing
- It’s confirming equity and crypto strength
What it means: Underneath the headlines, capital is repositioning for expansion — not contraction.
HYG: Credit Is Still Breathing
HYG tracks high-yield corporate bonds. If credit stress were brewing, this would be tanking.
Instead:
- HYG is holding above 75
- Spreads are stable, not blowing out
- No sign of forced liquidations or default pricing
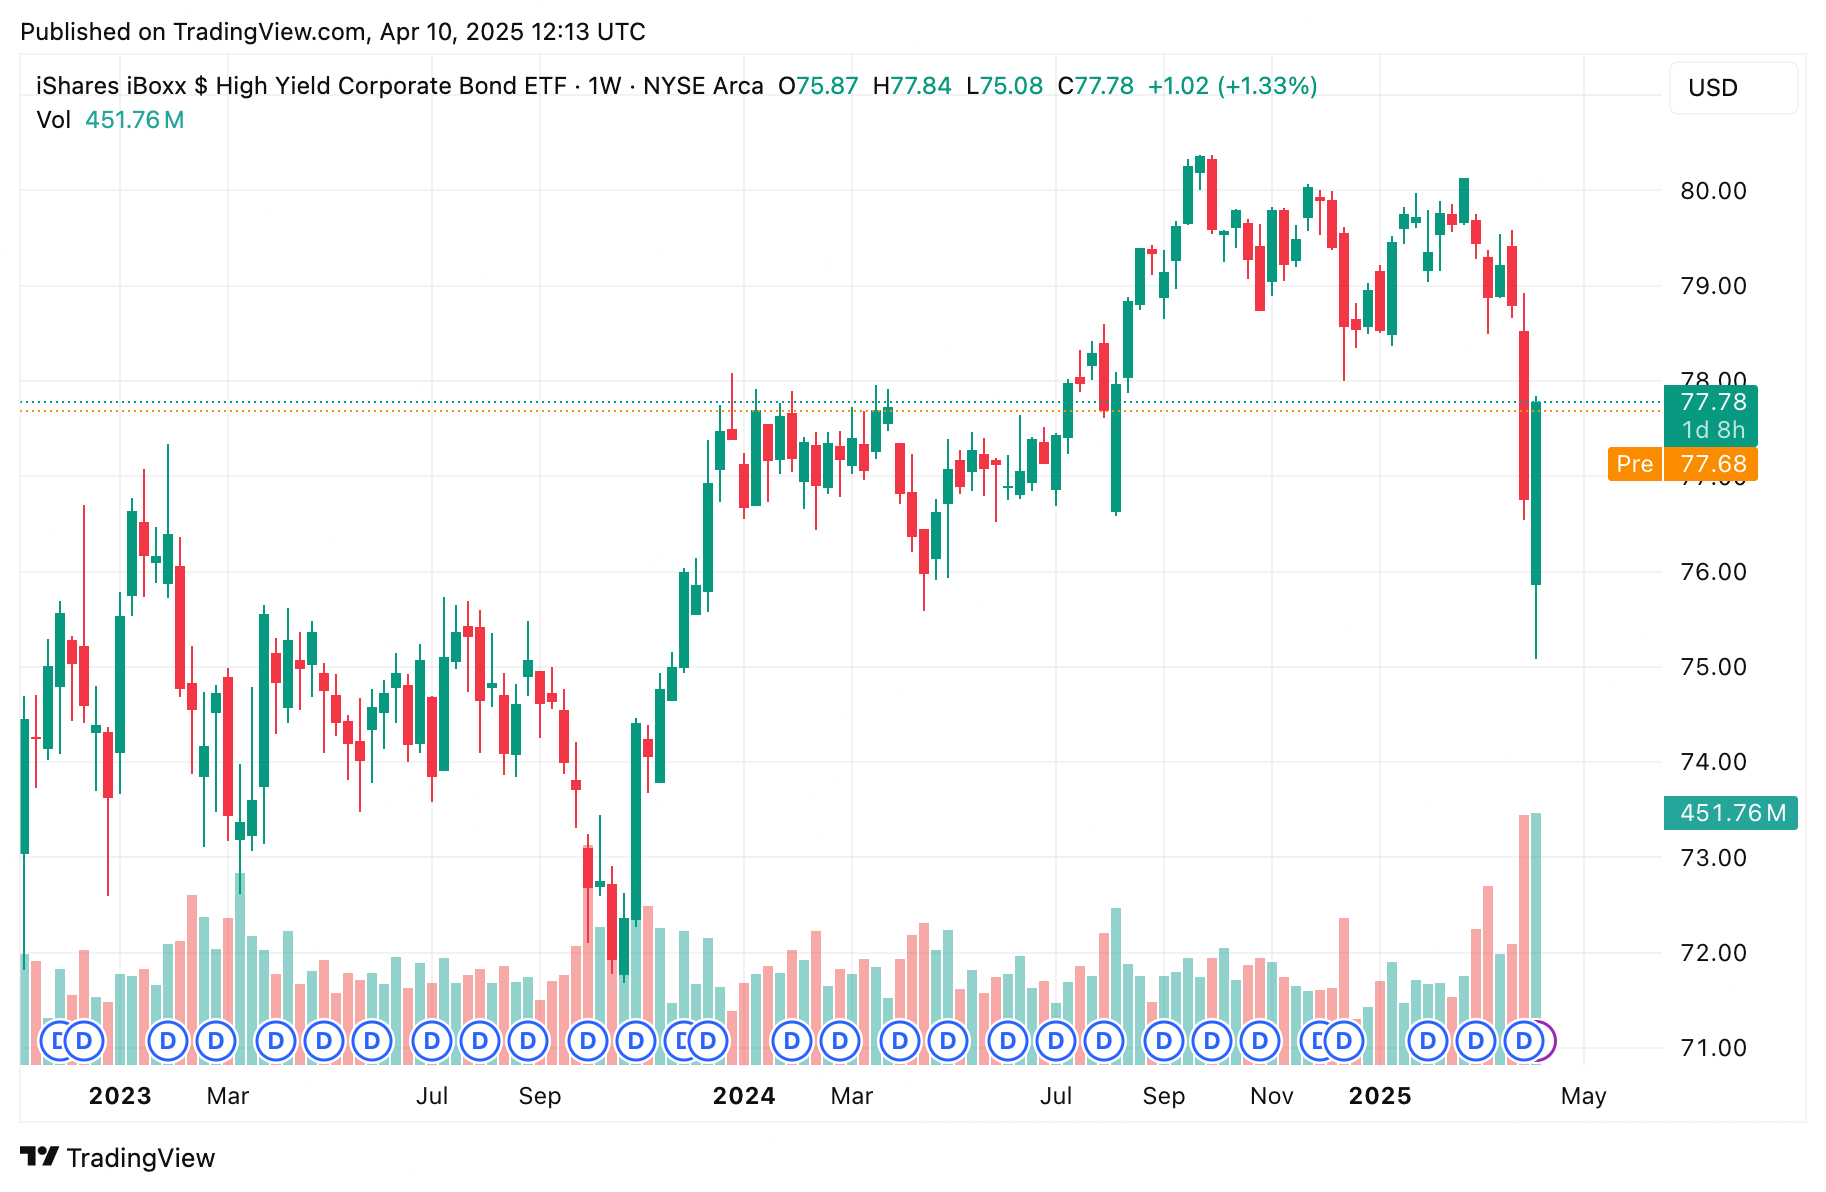
What it means: The system isn’t seizing up. Credit markets are functioning. This is the opposite of 2008.
Conclusion: The Structure Is Holding — Don’t Let Headlines Distract You
Each one of these charts — VIX, yields, dollar, copper, credit — is a real-time signal. And collectively, they’re pointing to one thing: this isn’t a breakdown. This is rotation. A pre-pivot regime shift. The positioning is shifting quietly. The structure is firming beneath the noise.
If you're still waiting for a trigger, you're missing it. The market’s already moving.


Discussion